Today, I was asked by my client for a way to produce a power consumption report on their ESXi Hosts by Cluster. I wasn’t sure initially if this was even possible, but after a quick search, I found a great launch point on the vRealize Operations Sample Exchange. I’m not going to reinvent the wheel here, but I’m going to list out the steps I took and what my Dashboard looked like when it was completed. Download the View & Dashboard before proceeding so you can follow along.
Enable the Metrics in the Policy (Watt)
- Login to vROPs
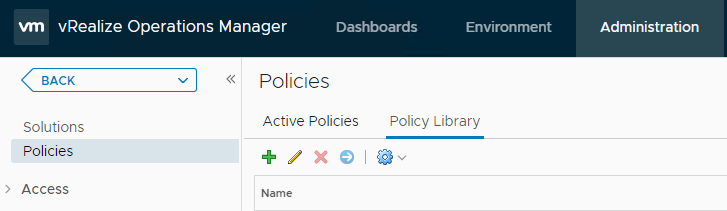
Verify that you1 have the necessary access rights to perform this task. Your vRealize Operations Manager administrator can tell you which actions you can perform. - After login, click on Administration
- Goto Policies & Policy Library
- Click on the Policy assigned to your Hosts (usually Default)
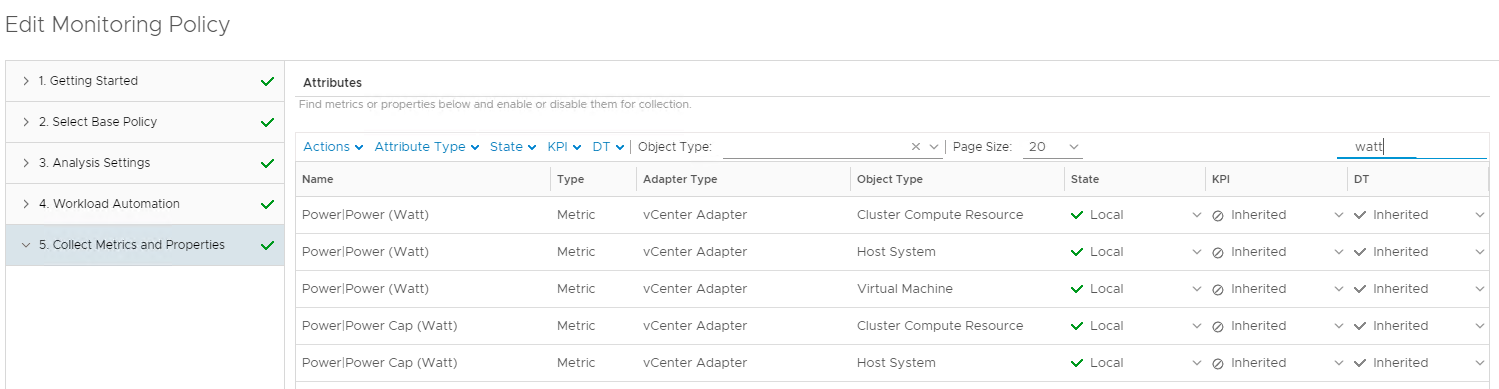
- Click on Edit & goto “Collect Metrics and Properties”
You might need to expand your screen here to make sure you can see the “Filter” option - Type “Watt” in the Filter and hit
- Make sure the “State” column shows “Local” and hit
Import the View into vROPs
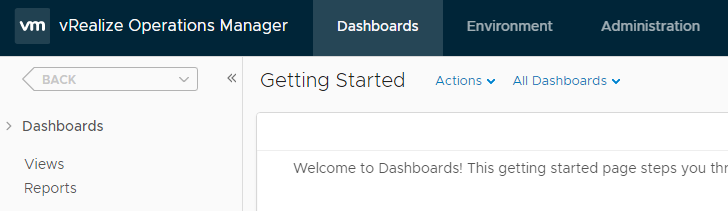
- Click Dashboards at the top & Views on the left sidebar
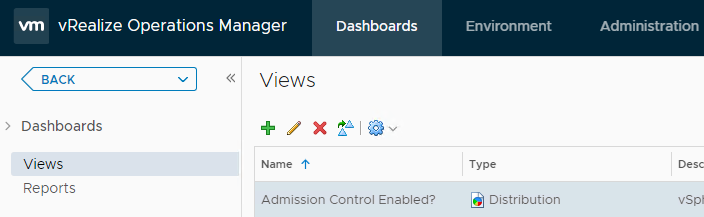
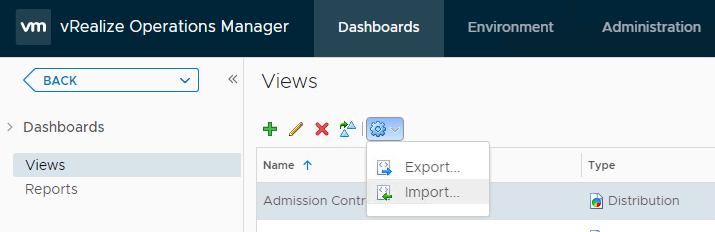
- Click the gear icon and select Import View
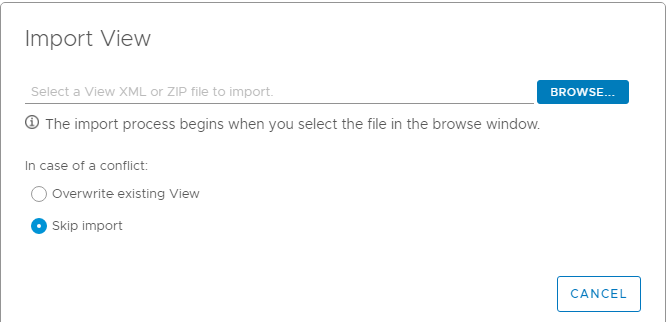
- Browse to select the downloaded XML file and click Import
The imported view overwrites if a view with the same name exists. All report templates that use the existing view are updated with the imported view.
Import the Dashboard into vROPs
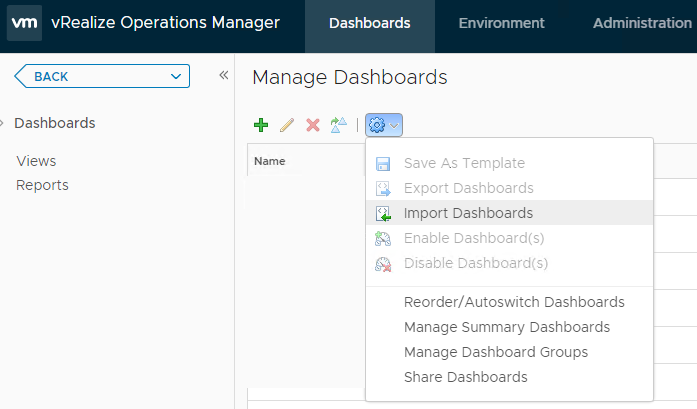
- Click Dashboards, Actions dropdown, and select Manage Dashboards
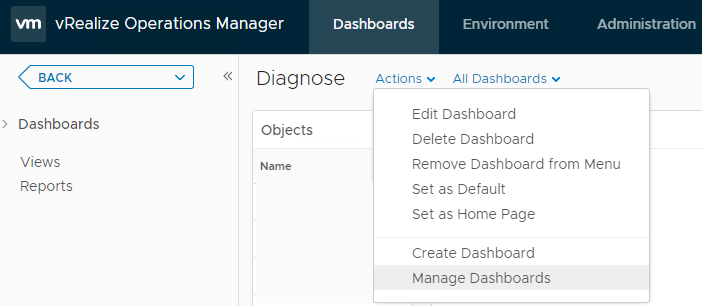
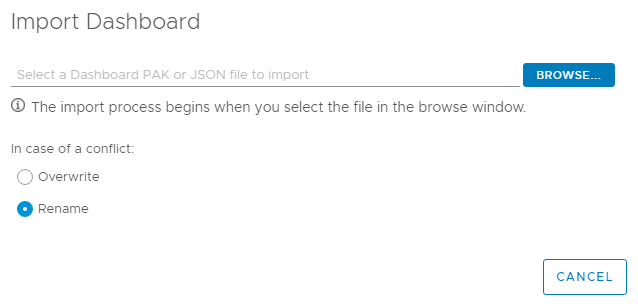
- Click on the gear icon and select Import Dashboards
- Browse to select the downloaded json file for the dashboard you want to import
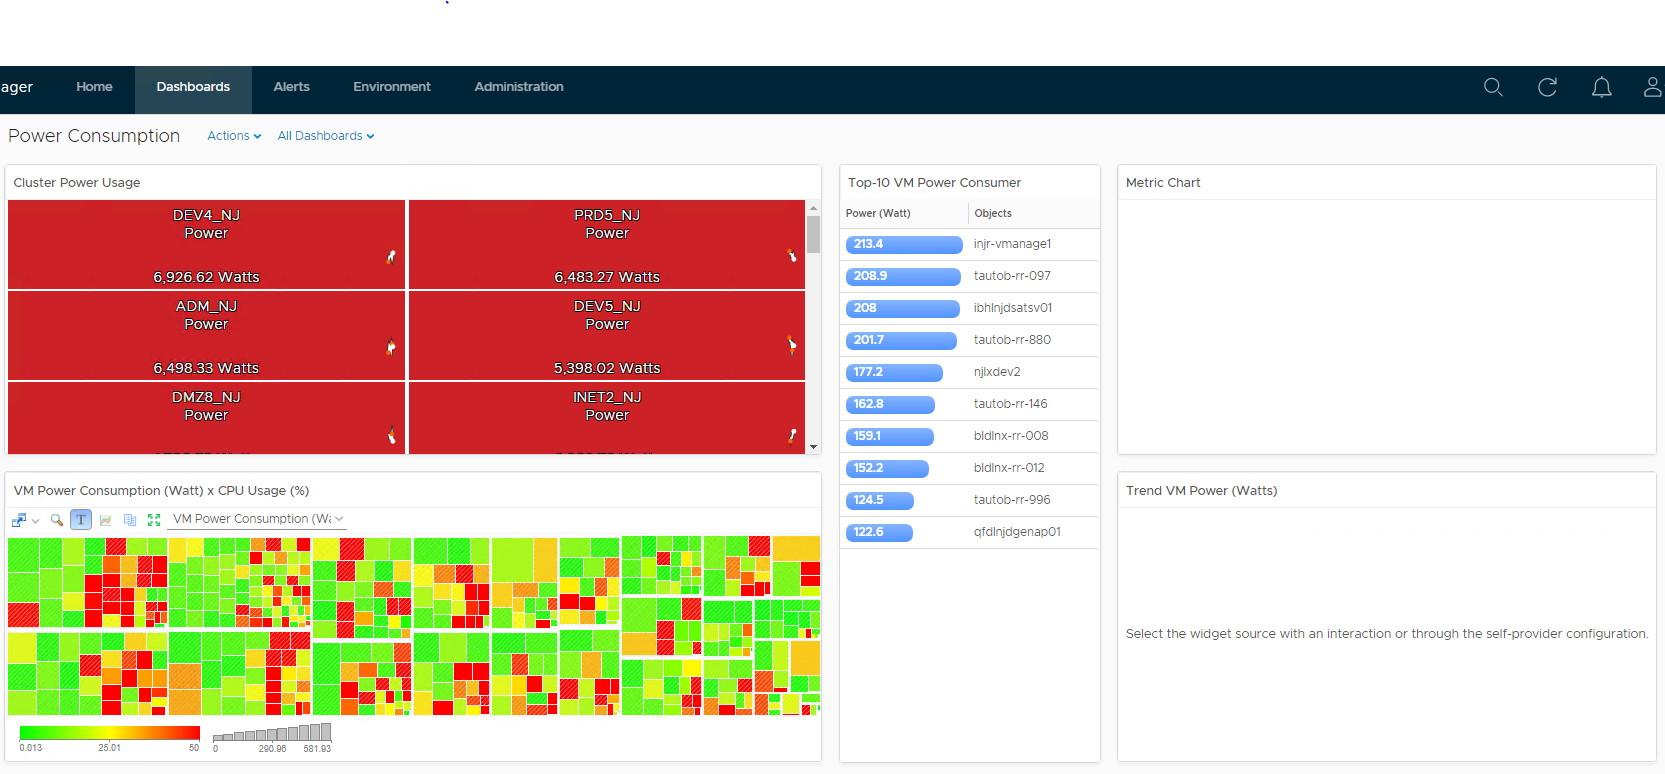
After data has refreshed into the collection, your Dashboard should similar to this: